Uncover Python’s Performance Secrets with cProfile
Read Time:8 Minute, 32 Second
In the dynamic world of Python programming, optimizing code performance is a never-ending quest for developers. Whether you’re building a web application, crunching numbers in data science, or working on any of this project, understanding how your code behaves under the hood is crucial. Profiling your code provides invaluable insights into bottlenecks, helping you identify areas for improvement and achieve faster execution times.
In this article, we embark on a journey to explore the art of profiling Python code using the cProfile module. Whether you’re seasoned or just getting started, this guide will demystify the world of code profiling, equipping you with the skills to uncover performance bottlenecks and boost your applications to new heights. So, fasten your seatbelts, as we dive into the exciting realm of code profiling!
In order to ensure that programs run at their peak efficiency, it is crucial to thoroughly evaluate their performance and identify any areas of slowdown. This is where the practice of code profiling becomes absolutely essential, particularly when working within the Python ecosystem and making use of the native cProfile module. Within this comprehensive guide, we will delve into the profound importance of Python code profiling and explore the inner workings of the cProfile module. This will empower readers with the knowledge and tools needed to not only boost software performance but also elevate user satisfaction to new heights.
Code Profiling Demystified
Let’s begin by understanding what code profiling truly entails:
Definition: At its core, code profiling is a meticulous assessment of software performance. It dives into the nitty-gritty of a program, gauging how each segment operates and how resources are consumed.
Importance:
- Performance Enhancement: One of the main goals is to determine areas of the code that may be hindering optimal performance. By identifying and refining these areas, a noticeable boost in software speed can be achieved;
- Resource Management: Efficient software isn’t just about speed. By pinpointing and optimizing the more resource-intensive segments of code, one can ensure the software consumes less memory and other system resources, leading to smoother operation even on less powerful devices.
Python’s Take on Profiling:
- When it comes to the Python programming language, the cProfile tool stands out. Not just a profiler, it’s an avenue for developers to gauge both execution time and memory usage of their Python scripts;
- The granular insights offered by cProfile enable developers to distinguish parts of the code that are both time-consuming and resource-intensive. Addressing these can lead to a holistic improvement in software performance.
Recommendation for Developers:
Regularly incorporating code profiling in the development workflow can result in software that’s not just efficient but also more reliable. By prioritizing resource optimization and performance, developers can ensure that the end-users have a seamless experience.
Tip: When working with Python, apart from cProfile, it might be beneficial to explore other profiling tools like line_profiler and memory_profiler to gain multifaceted insights into the software’s performance dynamics.
Introduction to cProfile and Output Interpretation
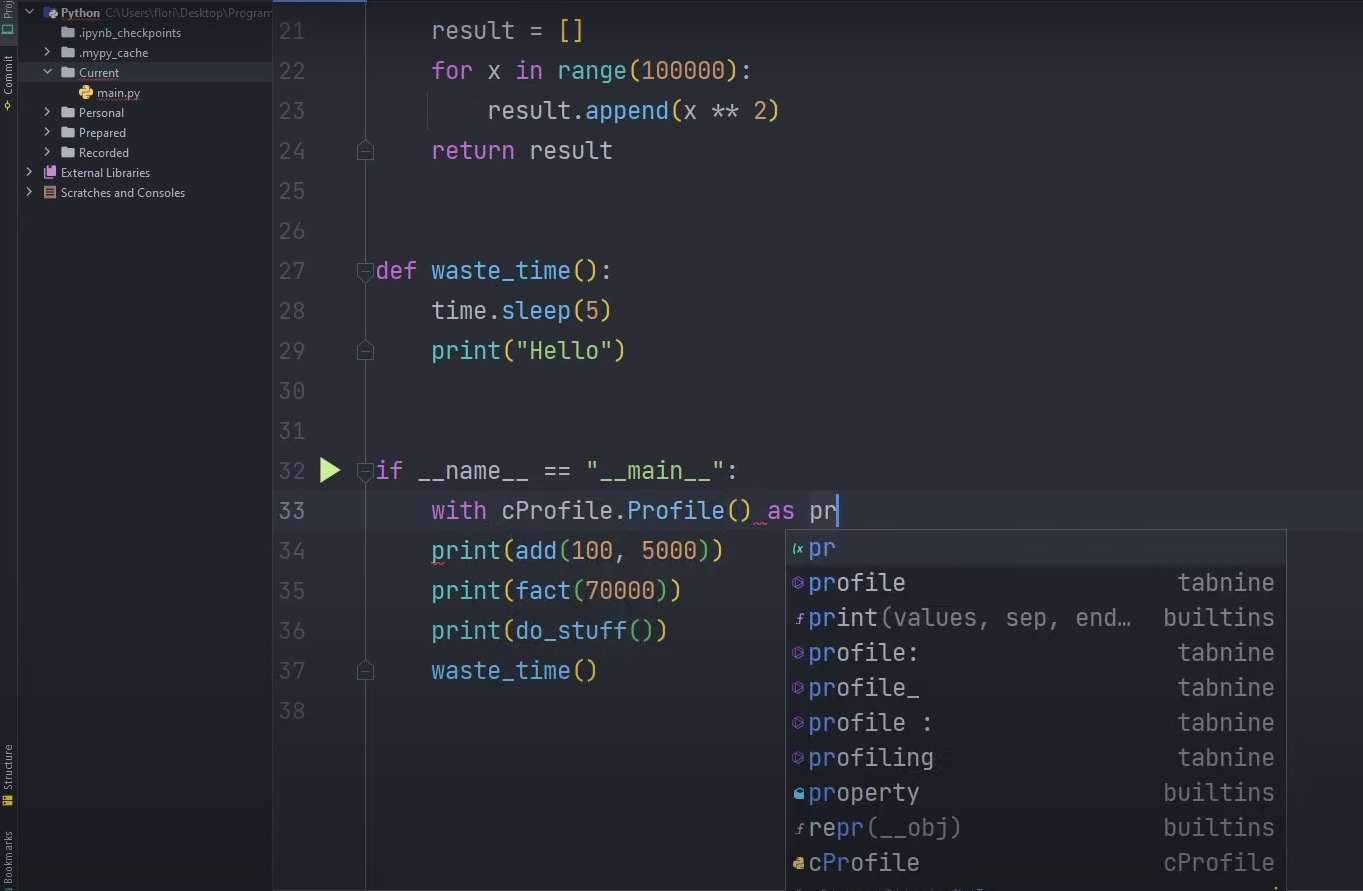
cProfile is a built-in module in Python designed to profile Python programs and assess their performance. Through profiling, developers can understand the runtime behavior of their code, helping them identify bottlenecks and optimize the performance of their applications.
Sample Profiling with cProfile:
To get started, consider this simple example where a regular expression is compiled:
import cProfile
import re

cProfile.run("re.compile('Python')")
When executed, the output provided by cProfile might look something like:
 4 function calls in 0.000 seconds
   Ordered by: standard name
   ncalls  tottime  percall  cumtime  percall filename:lineno(function)
        ...
Deciphering the Results:
- ncalls: This metric unveils the frequency of function invocations;
- tottime: It signifies the overall execution duration of a specific function, exclusive of time allocated to subsidiary function calls;
- percall (initial instance): This metric is obtained by dividing tottime by ncalls;
- cumtime: It reflects the cumulative execution time of a function, encompassing the time spent on all nested sub-function calls;
- percall (secondary instance): This value is computed by dividing cumtime by the count of fundamental calls;
- filename:lineno(function): This particular notation furnishes comprehensive insights into the codebase, pinpointing the precise location where the function is defined.
Using cProfile from the Terminal
For those who prefer working with the terminal or want to profile entire scripts, cProfile also offers this functionality.
Creating a Sample Script:
To demonstrate, let’s draft a straightforward Python script named main.py, which prints “Python Programming” five times:
for _ in range(5):
    print('Python Programming')
Executing this script will produce:
Python Programming
Python Programming
Python Programming
Python Programming
Python Programming
Profiling with Terminal:
To profile the above script, one can harness cProfile directly from the terminal or command prompt:
- Navigate to the directory containing the main.py script;
- Run the following command: python -m cProfile main.py;
- The output will not only show the results of the script but also provide a detailed breakdown of the performance metrics of every function involved, similar to the earlier mentioned output format.
Direct Code Profiling Using cProfile:
When seeking to enhance the performance of Python applications, it becomes imperative to acquire a deep understanding of the efficiency of each segment within your codebase. Python offers a potent tool for this purpose: the cProfile module.
To perform a direct profiling of a specific code segment employing the cProfile module, follow these steps:
Seamlessly incorporate the cProfile module into your script by importing it.
Deliberately initiate the profiling process by invoking the profiling function. Ensure to provide the code snippet that necessitates profiling, encapsulating it within a string argument passed to the cProfile.run() function.
import cProfile

cProfile.run("print('Python Programming')")
On execution, the output would reveal:
Certainly, here’s a rewritten version of the text with enhanced vocabulary and varied sentence structure:
- “The expression ‘Python Programming’ pertains to the realm of Python programming language;
- Specifics regarding the quantity of function invocations and their corresponding execution durations are available for analysis;
- A meticulously organized catalog of function calls is at our disposal, encompassing both native Python functions and specialized profiler-centric methods.
Nevertheless, the practice of transmitting code in the form of a string, though pragmatic for succinct code snippets, may not be the most user-centric or adaptable technique. Particularly when dealing with extensive code blocks, this methodology can swiftly become cumbersome.”
Profiling Using Functions with cProfile:
A more versatile and organized approach involves encapsulating the desired code within a function and then profiling that function.
Consider the following Python function named my_func that prints ‘Python Programming’ five times:
def my_func():
    for _ in range(5):
        print('Python Programming')
To profile my_func(), the process is quite straightforward:
First, ensure the cProfile module is imported.
Profile the function by passing its name, as a string, to the cProfile.run() method.
import cProfile

def my_func():
    for _ in range(5):
        print('Python Programming')

cProfile.run('my_func()')
When the code runs, the output will display:
- ‘Python Programming’ printed five times;
- A summary of function calls made, inclusive of the time taken;
- A detailed breakdown, in order, of all function invocations.
This method allows developers to structure their code in a modular fashion and profile specific functions without mixing profiling code with business logic.
Extracting Profiling Data Using cProfile and pstats
Profiling is a pivotal technique in understanding the performance dynamics of Python code. By default, using the cProfile module prints the results directly to the terminal. However, there are instances when a developer might wish to save these findings for future reference or detailed analysis. The following sections guide on achieving this by combining the powers of cProfile with pstats.
Storing Profiling Results in a File
Utilizing cProfile alone only displays the results in the terminal. The profiling data can, however, be saved into a file for further analysis. This is achieved by providing the filename argument when using the cProfile.run() function.
For instance, consider a basic function that prints ‘Python Programming’ five times:
import cProfile

def my_func():
    for i in range(5):
        print('Python Programming')
By default, invoking the cProfile to profile this function will display the results in the terminal. To store these results in a file named ‘results’, modify the cProfile invocation as follows:
cProfile.run('my_func()', 'results')When you execute this, the terminal will only display the prints from my_func(). However, in the project’s directory, a new file named ‘results’ will appear, which holds the profiling data.
Accessing the Saved Profiling Data
Directly opening the ‘results’ file won’t display readable content because it’s in a binary format. This is where the pstats module comes into play. It can convert this data into a more comprehensible format.
Here’s how one can transform the ‘results’ file into a readable ‘results.txt’:
import pstats

with open('results.txt', 'w') as file:
    profile_data = pstats.Stats('results', stream=file)
    profile_data.print_stats()
This code block creates (or overwrites if it exists) a ‘results.txt’ file. The pstats.Stats object reads the binary data from ‘results’ and writes its textual representation into ‘results.txt’.
A Comprehensive Approach to Save and Access Profiling Data
Combining the steps outlined above, here’s a holistic code snippet for profiling a function, saving the results, and converting them into a readable format:
import cProfile
import pstats

def my_func():
    for i in range(5):
        print('Python Programming')

# Profiling the function and saving the data into 'results'
cProfile.run('my_func()', 'results')

# Converting the 'results' file into a readable 'results.txt'
with open('results.txt', 'w') as file:
    profile_data = pstats.Stats('results', stream=file)
    profile_data.print_stats()
With this approach, developers can effectively manage their profiling results, enabling more in-depth performance analysis and optimization strategies for their Python applications.
Conclusion
In this piece, we delved into the art of Python code profiling using the cProfile module.
The process of code profiling serves as a diagnostic tool, pinpointing the bottlenecks within your codebase. It provides invaluable insights, shedding light on the precise segments of your code that warrant optimization for enhanced overall performance.
If you find yourself with any queries or recommendations for refinements, please don’t hesitate to share your thoughts in the comments section below.
Happy
0 %
Sad
0 %
Excited
0 %
Sleepy
0 %
Angry
0 %
Surprise
0 %

Average Rating