Davies-Bouldin Index for K-Means Assessment
Read Time:5 Minute, 0 Second
The task of assessing the effectiveness of K-Means grouping models is indispensable for data science projects. One of the most robust and commonly employed metrics for this is the Davies-Bouldin Index.
The article aims to offer an exhaustive guide on leveraging this metric in Python for K-Means model evaluation. Not only will this feature advanced methods for execution but also practical considerations for accurate and insightful assessment.
Understanding the Davies-Bouldin Index
When it comes to the evaluation of K-Means cluster models, the Davies-Bouldin Index (DBI) is a cornerstone metric. This numerical gauge furnishes a ratio that juxtaposes the distances within each cluster to the separations between different clusters. The aim is to have a lower DBI score, which symbolizes a more coherent and well-defined cluster configuration. Essentially, it’s an expedient means for ascertaining the effectiveness of your clustering models.
- Intra-Cluster Distance: This is calculated as the mean distance between each element in a cluster to the centroid of that cluster. It offers insights into how closely grouped the elements within a single cluster are;
- Inter-Cluster Distance: This metric assesses the average distance between different clusters by measuring how far apart each cluster’s centroid is from others. The aim is to have this distance as large as possible to ensure well-separated clusters.
The balance between these two distances, articulated as a ratio, forms the crux of the Davies-Bouldin Index.
Implementing Davies-Bouldin Index in Python
Python offers a plethora of libraries that facilitate data analytics, and among these, Scikit-learn reigns supreme for machine learning applications, including cluster appraisal. Scikit-learn incorporates a specific function under its metrics module designed for calculating the DBI. Using the davies_bouldin_score function, the evaluation process becomes largely streamlined.
from sklearn.metrics import davies_bouldin_scoreOnce your K-Means model has been properly trained on your dataset, calculating the DBI is straightforward. You simply employ the following syntax:
db_score = davies_bouldin_score(X, labels)Interpreting Davies-Bouldin Index Results
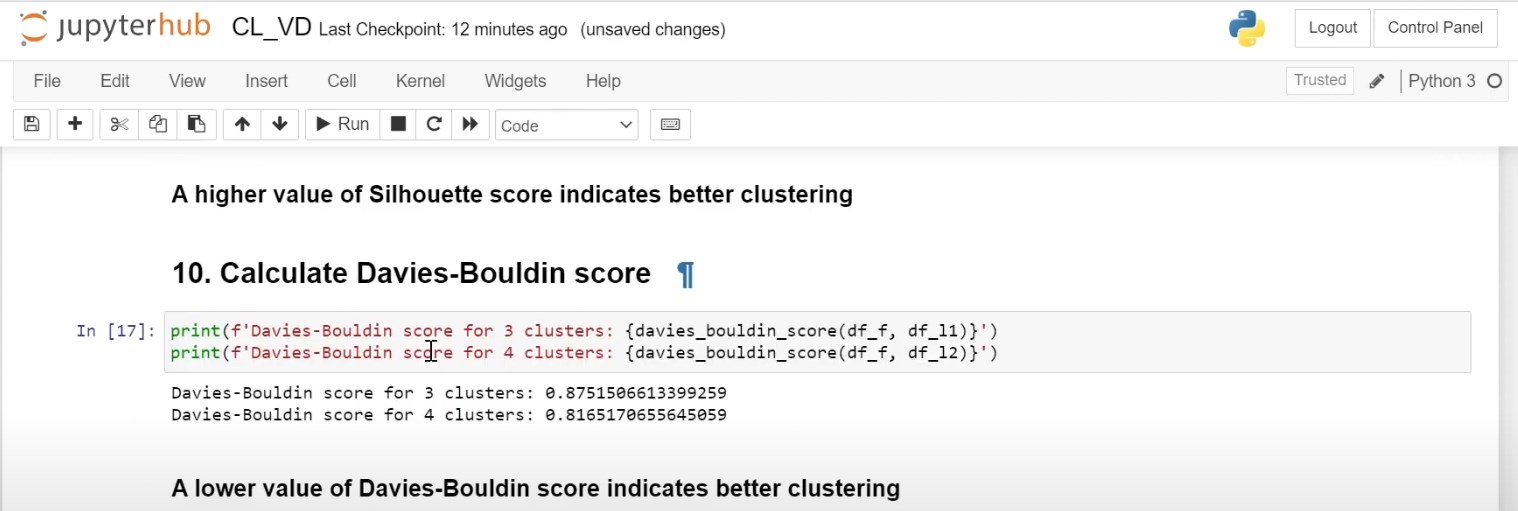
Interpreting the DBI is typically clear-cut: a lower value signifies better cluster formation, with zero being the absolute ideal score. Nevertheless, relying solely on DBI for K-Means cluster analysis would be imprudent. It should be used in conjunction with other metrics for a more holistic evaluation.
- Lower Score: A lower DBI signifies well-clustered, distinct, and separated groups;
- Higher Score: On the other hand, a higher DBI points towards blurred or overlaid clusters, signaling a need for model refinement.
Practical Use-Cases of Davies-Bouldin Index
The utility of the DBI transcends various domains:
- Marketing Analytics: The DBI can play an instrumental role in segmenting customers based on their buying habits or engagement levels, aiding in targeted marketing strategies;
- Healthcare Analytics: It finds relevance in categorizing gene expressions or patient data into meaningful clusters for focused research;
- Finance: Asset managers often use the index for portfolio diversification, classifying assets into distinct categories to minimize risk while maximizing returns.
Considerations Before Using DBI
Before deploying the DBI for any K-Means model evaluation, it’s crucial to examine the scaling of the dataset attributes. The sensitivity of DBI to feature magnitudes can lead to skewed results. Pre-processing methods like MinMax scaling or Z-score standardization, available in Scikit-learn, should be leveraged.
Limitations of Davies-Bouldin Index
While the DBI is a powerful metric, it’s not free from drawbacks. Its sensitivity to outliers is a notable limitation. The presence of extreme values in the dataset could inflate or deflate the DBI, leading to potentially deceptive conclusions about the quality of the clusters.
Alternative Metrics to Davies-Bouldin Index
DBI is highly reliable but not infallible. There are other metrics like the Silhouette Score or Dunn Index that also provide significant insights into the quality of clusters. These alternative metrics bring different evaluative angles to the table and may be more appropriate depending on the data distribution.
Future Trends in Cluster Assessment
The landscape of machine learning is dynamic, with consistent advancements in algorithms and evaluation metrics. Deep learning methods, for instance, are being increasingly incorporated for unsupervised learning tasks like clustering. This suggests that more advanced evaluation metrics may soon emerge, overshadowing traditional tools like the DBI.
Integrating Davies-Bouldin Index with Other Machine Learning Techniques
Beyond its core application in K-Means clustering, the Davies-Bouldin Index can be synergistically combined with other machine learning techniques for more robust data analysis. For instance:
- Feature Selection Algorithms: Utilizing the DBI in conjunction with feature selection methods can help identify the most significant attributes that contribute to effective clustering. Techniques like Recursive Feature Elimination (RFE) or Feature Importance in Random Forests can be used prior to applying the DBI;
- Hyperparameter Tuning: For algorithms that involve multiple parameters like K-Means, DBI can serve as an objective function in optimization algorithms like grid search or randomized search. By evaluating the DBI score for various parameter combinations, optimal clustering configurations can be discovered;
- Anomaly Detection: While primarily used for cluster quality assessment, the sensitivity of the DBI to outliers makes it a potential tool for anomaly detection in data sets. An unusually high DBI score might indicate the presence of anomalies that warrant further investigation.
Incorporating DBI into more complex machine learning pipelines can offer nuanced perspectives, enhancing the robustness of data analytics tasks beyond mere clustering.
Conclusion
The Davies-Bouldin Index continues to be an indispensable evaluative metric for K-Means clustering analysis in Python. Its mathematical rigor and ease of interpretation make it a versatile tool. Nevertheless, practitioners should remain cognizant of its limitations and the merits of alternative metrics.
Given the evolving landscape of machine learning and data science, understanding the foundational metrics like the DBI while keeping an eye on emerging methodologies is essential for anyone involved in data clustering activities. With its potential applications in conjunction with other machine learning techniques, the DBI’s utility extends far beyond simple cluster evaluation.
Happy
0 %
Sad
0 %
Excited
0 %
Sleepy
0 %
Angry
0 %
Surprise
0 %
Average Rating