Exploring the Python Poisson Distribution: A Deep Dive
Read Time:6 Minute, 57 Second
The Python Poisson distribution is a powerful statistical tool that finds application in various fields, from science to engineering and finance. In this comprehensive guide, we will delve into the intricacies of the Python Poisson distribution, demystifying its concepts and demonstrating practical usage with Python code.

What is a Poisson Process
Before we embark on our exploration of the Poisson distribution, let’s establish a solid foundation by understanding the concept of a Poisson process.
A Poisson process is a mathematical model that provides a framework for describing a sequence of events occurring at random points in time or space. This model has several key characteristics that set it apart:
- Randomness: Events in a Poisson process happen randomly, with no fixed pattern or schedule. They can occur at any moment, independent of when previous events took place;
- Independence: Each event is independent of the others. The occurrence of one event doesn’t affect the likelihood of another occurring, making it suitable for modeling events such as customer arrivals at a store, phone calls to a call center, or the decay of radioactive atoms;
- Constant Rate: The events have a constant average rate of occurrence denoted by λ (Lambda). This parameter represents the average number of events happening in a unit of time or space. It’s a crucial parameter when working with the Poisson process and the Poisson distribution derived from it;
- Exponential Waiting Times: The time between consecutive events in a Poisson process follows an exponential distribution. This means that the probability of an event occurring within a specific time interval is constant and independent of when the last event happened.
The Poisson process serves as the foundation upon which the Poisson distribution is built. It provides a theoretical framework for understanding random event occurrences, making it a valuable tool in various fields, including telecommunications, finance, and epidemiology.
Now that we have a firm grasp of the Poisson process, we can seamlessly transition to exploring the Poisson distribution, which is a probability distribution that quantifies the number of events occurring in a fixed interval when the average rate of occurrence is known. This distribution is particularly useful for making predictions and understanding the likelihood of rare events.
What is a Poisson Distribution
The Poisson distribution is a probability distribution that characterizes the number of events occurring in a fixed interval of time or space, given a known average rate of occurrence. Here are the key elements:
- λ (Lambda): The average rate of events happening in the given interval;
- k (k): The number of events we want to find the probability for.
Poisson Distribution Example
To solidify our understanding of the Poisson distribution, let’s walk through a practical example that mirrors real-world scenarios.
Imagine you’re managing a busy call center, and on average, it receives 20 calls per hour. You want to use the Poisson distribution to calculate the probability of receiving exactly 15 calls in the next hour. Here’s how we can break this problem down step by step:
Step 1: Define the Parameters
In this scenario, we have:
- λ (Lambda) = 20, which represents the average rate of calls per hour.
Step 2: Formulate the Question
We want to find P(X = 15), where X represents the number of calls received in an hour.
Step 3: Apply the Poisson Probability Formula
The probability mass function (PMF) for the Poisson distribution is:
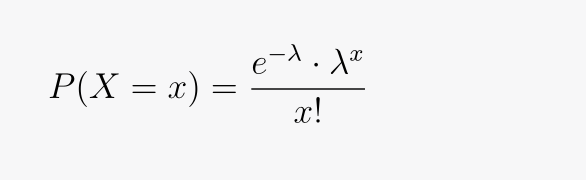
In this formula:
- P(X = x) represents the probability of observing x events;
- λ (Lambda) is the average rate of events;
- e is Euler’s number (approximately 2.71828), the base of natural logarithms;
- x! (x factorial) is the factorial of x.
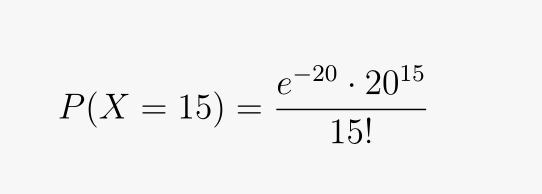
Step 4: Plug in the Values
For our scenario:
- x = 15;
- λ (Lambda) = 20.
Using the Poisson PMF formula:
Step 5: Calculate the Probability
Calculating this expression gives us the probability of receiving exactly 15 calls in the next hour. It’s a numerical value that quantifies the likelihood of this specific event occurring.
This example showcases the practical utility of the Poisson distribution in predicting and understanding event occurrences, making it a valuable tool in scenarios where event arrivals follow a random and independent pattern, such as call centers, website traffic analysis, or accident modeling in insurance.
In the next sections of this guide, we’ll delve deeper into the mathematics behind the Poisson distribution, explore how to compute these probabilities with Python, and visualize the distribution for even clearer insights.
Poisson PMF (Probability Mass Function)
The Probability Mass Function (PMF) associated with the Poisson distribution is an invaluable tool for assessing the likelihood of obtaining a specific value (k) in a dataset following the Poisson distribution. This mathematical function is instrumental when you seek to gauge the probability of discrete events taking place.
Calculating Poisson PMF Theoretically
So, the Poisson PMF can be expressed by the formula:
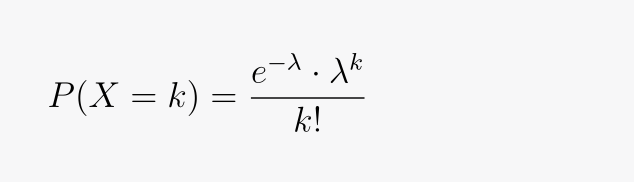
- P(X = k) signifies the probability of observing precisely k events;
- λ (Lambda) denotes the average event rate;
- e stands for Euler’s number (approximately 2.71828), the base of natural logarithms;
- k! (k factorial) represents the factorial of k.
Poisson CDF (Cumulative Distribution Function)
The Cumulative Distribution Function (CDF) associated with the Poisson distribution enables you to ascertain the probability of observing equal to or less than a specific value (k) in a dataset adhering to the Poisson distribution. It’s a vital tool for evaluating cumulative probabilities and comprehending the overall event distribution.
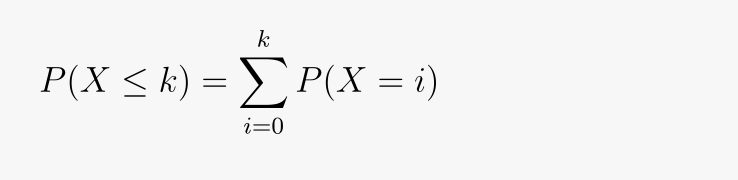
Calculating Poisson CDF Theoretically
The theoretical expression for Poisson CDF necessitates summing up probabilities for all values from 0 to k:
Calculating Poisson CDF in Python
Python, in synergy with libraries like SciPy and NumPy, offers efficient methods for computing Poisson CDF.
Plot Poisson CDF using Python
Visualization of the Poisson CDF can illuminate cumulative probabilities and the broader behavior of the distribution. By leveraging Python’s visualization capabilities, particularly through Matplotlib, you can craft insightful CDF plots that deepen your understanding.
In the subsequent sections of this guide, we will not only elucidate these concepts further but also provide practical Python examples.
These examples will empower you to seamlessly integrate Poisson PMF and CDF calculations into your data analysis toolkit, while also showcasing the creation of illuminating visualizations.
Conclusion
The Python Poisson distribution stands as a formidable ally in the realm of statistics and data analysis. With a profound grasp of Poisson processes, a comprehensive understanding of the distribution, and practical Python implementations, you wield a versatile tool capable of tackling a myriad of real-world challenges involving event counting across time or space. Whether your endeavors involve modeling call center activity, forecasting website traffic, or delving into the realm of rare events, the Poisson distribution, coupled with Python’s computational prowess, equips you to make well-informed decisions with unwavering confidence.
Unlock the potential of the Python Poisson distribution:
- Call Center Optimization: In the bustling world of customer service, understanding call arrival patterns is pivotal. Utilize the Poisson distribution to model call center activity, enabling efficient staffing and resource allocation;
- Web Analytics: Predicting website traffic fluctuations is essential for online businesses. Employ the Poisson distribution to estimate the number of daily visitors, enhancing your capacity to manage server resources effectively;
- Rare Event Analysis: In scenarios where rare events can have significant consequences, such as equipment failures or disease outbreaks, the Poisson distribution aids in risk assessment and preparedness planning;
- Queueing Theory: Dive into the world of queueing theory, where the Poisson distribution plays a central role in analyzing waiting times and optimizing processes in various fields, including transportation and manufacturing;
- Finance: Explore applications in finance, where the Poisson distribution helps model market volatility, default risk, and rare events like flash crashes;
- Scientific Research: Scientists employ the Poisson distribution to analyze phenomena such as radioactive decay, particle collisions, and the distribution of biological events like neuron firing;
- Environmental Monitoring: In environmental studies, the Poisson distribution can be instrumental in assessing the frequency of natural events, such as earthquakes or meteor impacts.
The Python Poisson distribution is your gateway to unlocking hidden patterns and gaining insights into the unpredictable. It empowers you to harness the power of probability and statistics to make data-driven decisions in a world where events unfold with both randomness and regularity. Armed with this knowledge, you have the tools to explore, model, and make sense of the complex and fascinating world of events and occurrences.
Happy
0 %
Sad
0 %
Excited
0 %
Sleepy
0 %
Angry
0 %
Surprise
0 %
Average Rating